Guest Articles & White Papers
How to Increase Alpha
By Scott H. Fullman, CMT — At a meeting of the Hedge Fund Association (HFA) on May 10th there were several complaints that managers were having a difficult time creating outperformance, also known as alpha. Portfolio and money managers are paid not only to manage money but to enhance returns and manage risk. When we heard that there is increasing levels of difficulty creating alpha, we immediately jumped to action.
For more than 30 years we have worked with portfolio managers and professionals around the globe to help manage investments. We built a platform that combines technical analysis with some quantitative analysis, macro analysis, market intelligence, and the creation of strategies to enhance returns, reduce capital risk, and increase the probabilities for success over a greater range of prices.
In 2009 I wrote a book for Bloomberg, entitled Increasing Alpha with Options. This led me to register the trademark Increasing Alpha®, which has become the brand name under which I have been publishing research since. Increasing Alpha® has three major tenets, as we mentioned earlier. The first is that we aim to enhance returns beyond those generated by the broad market. We use the S&P 500 Index (SPX) as our benchmark and compare performance of each of our suggestions with the performance of SPX. This is how we judge how well our ideas are working or not. This is Alpha!
 A top-down approach gives us a good view of the market as a whole, the sector and industry group, and then the individual security. By understanding where the leaders and laggards are, on both an absolute and relative basis, we can tell which instruments have the higher probabilities of achieving a profit or realizing a loss. We also pay special mind to momentum, as we want to buy shares of companies where upward pressure is increasing, and where those shares are outperforming others in their group, sector, and against the broad market. By identifying the leading sectors, industry groups within those sectors, and stocks within those industry groups we are able to find what we believe is the best of the best.
Understanding the macro point of technical analysis is extremely important.. Knowing which direction or phase that the broad market is trading in, as well as the outside influences that may change that phase, is extremely valuable. As part of our work we look at various asset classes, including treasuries, commodities, and currencies and how they may impact the US equities markets. This is referred to as intermarket analysis. Additionally, as part of our macro review of technical analysis we perform a function that many technical analysts do not do. We refer to it as forensic technical analysis. This is where we work backwards and trace the money flows. If we know where the money is coming from and where it is going to we can project the length of a bullish or bearish move and understanding what is driving that move. We owe partial credit to a former colleague who is an expert on the credit markets. This led to our macro themes of Financial Engineering and our development of Financial Engineering Version 2, which has been an overriding contributor to our bullish long-term outlook and has kept us from falling into the traps that other analysts have fallen into.
It is our belief that starting with a stock, Exchange Traded Fund (ETF), or other investable instrument is the right place. While fundamentals are important to a company we find that for performance sake looking at the trading instrument is more important. The CEO of a company may be on television talking about the merits of his/her firm, the expectations, and all of the positive happenings there but if the shares are declining in price the investors are losing money. We have found it to be both profitable and productive to concentrate on what and how an instrument is trading as our first point of contact. As part of our analysis we review more than 3,000 charts per week.
We also screen for options activity in those 3,000 stocks, funds, and indexes. Since 2002 the adoption of puts and calls by institutions has expanded exponentially. In many cases institutions are using the options markets to initiate their first positions in a company, or hedging equity positions using exchange traded puts and calls. In our screenings we look at unusual options volume as well as changes in implied volatility, which is the valuation of risk determined by the price paid for an options contract. Increases in implied volatility indicate that the buyer of a put or call is willing to pay more and that is indicative of a need to purchase those contracts.
Now on to the good stuff….alpha. It is our belief that people pay for creativity. It is not just about coming up with ideas on a stock, ETF, or index, but it is setting up how you invest or trade in the position. Using our expertise in exchange traded puts and calls we can create various strategies, based on market conditions, that allow us to pursue higher returns while reducing risk exposure, and in many instances we can simultaneously improve the probability for success.
 For those not familiar with options strategies, let us start with a basic business understanding. If you are opening a new enterprise one of the first things that you do is create a business plan. This plan may be shown to bankers and potential investors in order for them to become familiar with your new or pending company. They will evaluate risk, the potential for profit, and how quickly they might see their money back. If the risk levels are too high you may have to give up something, like higher interest. If the risks exceed a certain percent it might be difficult or impossible to find investors. We treat strategy creation in the same way and ask ourselves, “How can we improve the chances for making a profit on this investment?” We also look to lower risks even further.
We have taught professional traders, including market-makers, how to trade options and stocks. From international portfolio managers to local registered representatives we have shown decision makers how to change their approach to taking a position, and that has helped them to benefit from the tools the market provides. We practice what we preach as well, developing and disseminating ideas nearly every trading day.
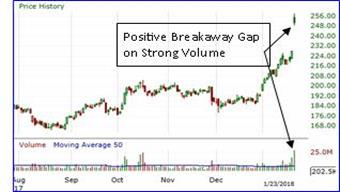
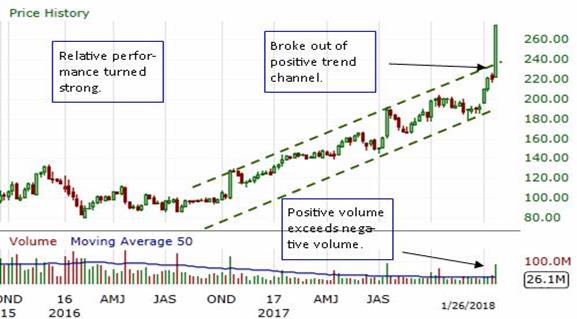
Here is an example of what we do and how we do it. Chart I is a daily graph of a specialty retailer which we will call XYZ Media Sales, and trades with the fictitious ticker symbol XYZ. This was an actual idea that we had published in January 2018, but for the sake of anyone mistakenly attempting to replicate this idea at this time we have disguised its identity. At that time the stock was priced at $250.29 and the S&P 500 Index was 2,839.13. XYZ had just broken out of a short-term positive continuation pattern with strong momentum indicators and improving relative performance versus the sector and the broad market. We noted that the price oscillator was positive yet extremely overbought, so the construction of strategy was tactical. The weekly chart (Chart II) also showed a positive breakout as well with a strong positive candlestick (chart methodology that we employee), also showing positive momentum and overbought oscillator readings. We had projected a technical target of $290 and our stop was at $234.25, but we noted that given the overbought conditions that we would not chase the stock. Instead we decided that the best course of action was to write or sell an out-of-the-money put contract.
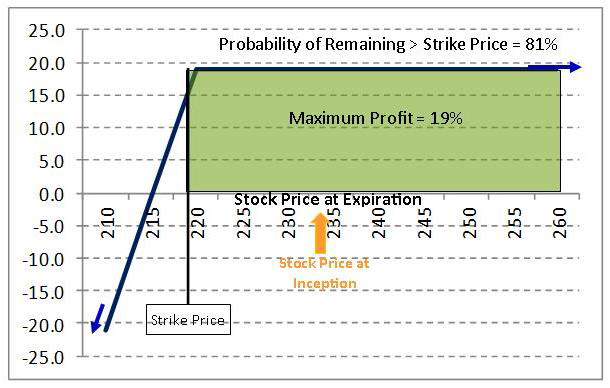
 We looked at the term structure and skew of the put contracts available, staying within our guidelines of limiting such a strategy to less than generally a six month exposure, and we saw that, on a comparative basis, the 3-month 12% out-of-the-money put was fairly attractive. The exercise or striking price for that contract was $220. Our obligation was that we would purchase the shares of XYZ for an effective price of $220 if the shares dropped more than 12% during the holding period and remaining life of the options contract. For that obligation we were paid a premium of $4.75/share, meaning that our potential acquisition price of the shares was $215.25. The delta, which represents the relationship of movement between the stock price movement and the change in value for the option, was -19%. That means if the stock rose or fell $1 the option should move $0.19/share over during the next several days. Think of the delta as the option version of beta between the stock and SPX. Additionally, based on how the options market was pricing that option, at the time, there was only a 19% probability that the stock would drop below the $220 striking price of the option, meaning that there was an 81% probability that the option would expire worthless. Referring to our earlier reference, this is what investors in a business would be looking for before investing in a company.
The industry minimum margin or capital requirement for an investor using this strategy would be $25.03/share. This is the figure that we use to determine our return on the trade. We note that many institutions, including hedge funds and other professionally managed accounts, may have a smaller or no actual cash requirement, utilizing other holdings such as US treasury securities, or by using portfolio optimization. If an investor purchased the shares on margin, using the standard Regulation-T margin requirement, they would have to put $125.15/share. So not only does our idea increase the probability of a successful outcome but we also increase the return by using the options margin requirement to further leverage the investment.
So, based on our suggestion if the stock declined as much as 12% to the share price remaining unchanged during that period, to the potential for the stock rising to infinity, we stood to make $4.75/share. Based on the industry minimum requirement, the return would be 19% for less than a three month actual holding period. Again, since we are using the requirement for an individual investor, the returns for a hedge fund or other professionally managed account may be significantly greater.
The risk in the short or put writing strategy is being put the shares at a lower price. This is a risk because, chances are that if you are put the shares that the stock will be below your cost basis, thereby producing a loss. So should XYZ fall below the $220 strike price, and the put is assigned (you are forced to buy the shares), then your adjusted cost for owning the position would be $215.25 ($220 strike price – $4.75 premium from the sale of the option). That means if we own the shares through the assignment of the put contract that our break-even price is $215.25 or 14% below the price that the stock was when we initiated the strategy. This analysis does not include transaction costs.
Sometimes it is easier to visually examine the results. Chart III is a payoff chart on the strategy showing the range of profitability and Chart IV compares the put writing strategy versus buying the shares. Note that these are percentage returns and not a dollar based profit and loss chart.
 Each options contract represents 100 shares of stock so we remind managers to use caution when initiating a strategy. We also believe that you should understand the use of puts and calls and their relationships to their respective underlying instruments.
This article highlighted one strategy on one stock. There are many other strategies that we have constructed and suggested to clients over the years. Changing market conditions, from trends to volatility movements, determine which strategies we will suggest at any given time. Additionally we seek to match strategies with the needs of our clients based on their risk profiles. Not all strategies are right for all funds.
We invite members of the Hedge Fund Association (HFA) to contact us to discuss our methods of Increasing Alpha.® Please contact me at (212) 688-2331 or at sfullman@reveresecurities.com for more information.
Disclosures
While the investment strategies included in this write-up are based on real market conditions and real securities at a moment in time, they should be considered fictitious for the purposes of this illustration, as they are being presented for scenario purposes only.
This write-up is intended to reflect one or more investment ideas to assist professional money managers on increasing alpha and reflects strategies that may or may not be profitable under similar or different market conditions. As with any investment or investment strategy, there are no guarantees of profit nor performance.
The material presented within is based on data and information we believe to be accurate; however, we do not warrant or guarantee such data or information as to its accuracy.
The opinions reflected within may not be the same opinions or strategies that Revere Securities LLC, its management or registered representatives use or undertake.
-

Join HFA today and enjoy all the member benefits, including access to HFA’s conferences, seminars and social events.